Why Track Your Game?
You bowl every week.
Do you know why your average isn't climbing?
Reckon you know your spare rate? Prove it. Most bowlers look at the total and call it a night — but your average is hiding clues in the pins you leave, the spares you miss, and the games where fatigue kicks in.
The average bowler has a visibility problem
You know your average. Maybe you know your high game. But can you answer these questions about your last session?
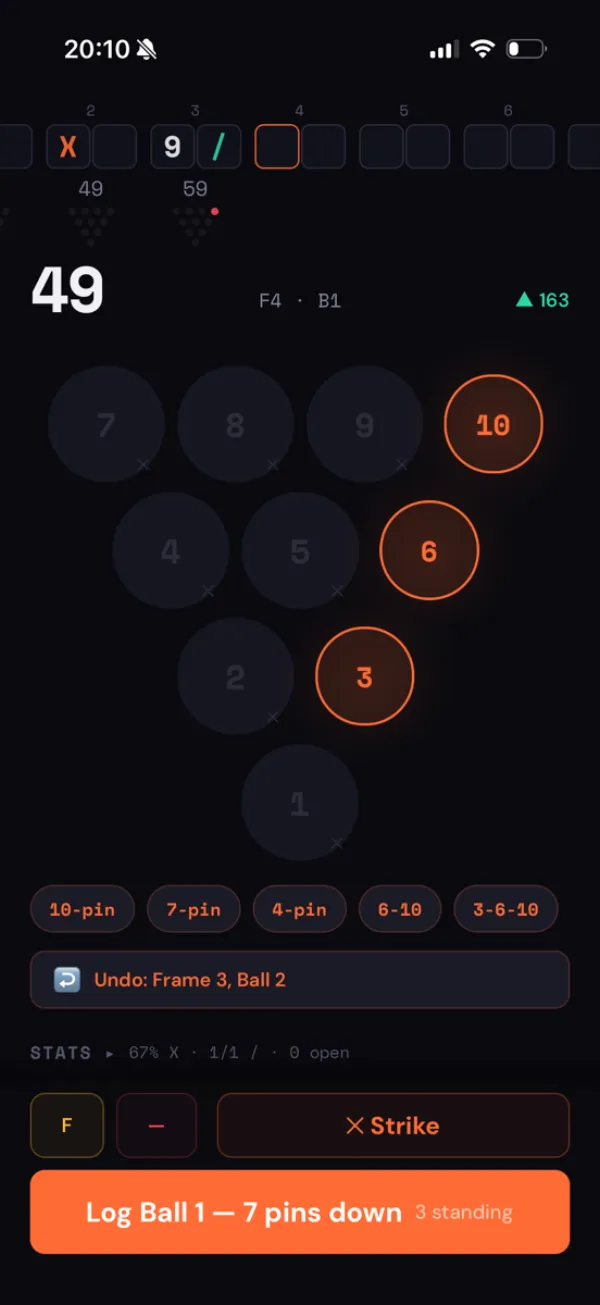
Which pin did you leave standing the most? Was it the 10-pin? The 7? A 3-6-10 split you keep seeing? Without tracking specific pin leaves, you're guessing.
What's your spare conversion rate by leave type? You might convert 80% of single-pin spares but only 30% of multi-pin leaves. That difference is worth 10+ pins per session.
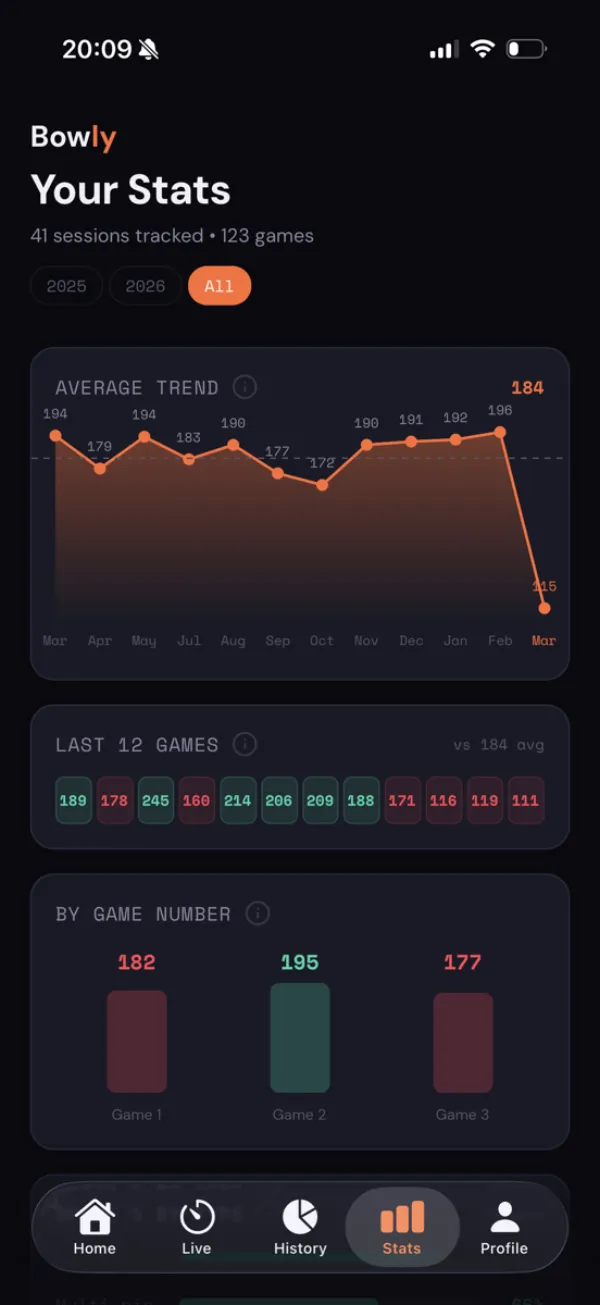
Does your game drop off in the third game? Fatigue affects everyone, but most bowlers don't realise how much. If your Game 3 average is 20 pins below your Game 1, that's 20 pins of improvement hiding in plain sight.
~15 pins
The estimated average improvement available to a 160-average bowler just by converting single-pin spares at a 75% rate instead of 50%. That's the difference between 160 and 175 — from one specific skill.
What tracking actually looks like
Here's the difference between bowling blind and bowling with data.
Without Tracking
"I averaged about 160 tonight. Game 2 was decent. I think I left a lot of 10-pins but I'm not sure."
"My average hasn't moved in months. I don't know what to work on."
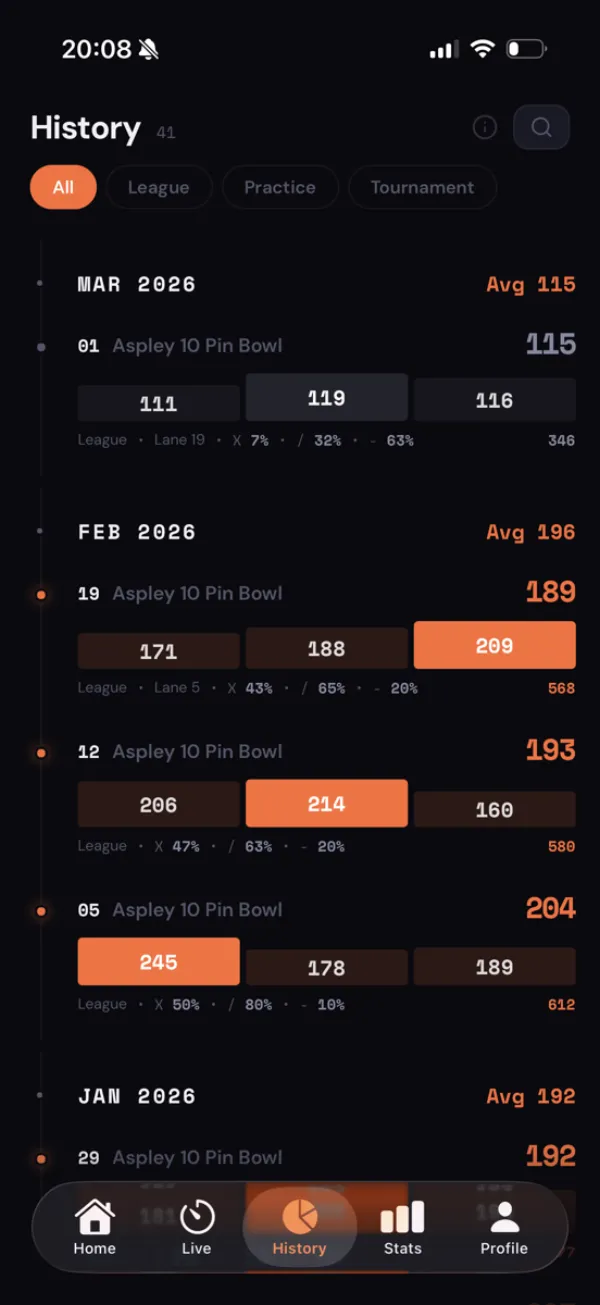
"I bowled better last season... I think? Hard to remember."
With Bowly
"I averaged 162 tonight. Games: 178, 171, 138. My third game dropped because I left the 10-pin 4 times and converted once."
"My 10-pin conversion is 42% this season. If I get that to 60%, my average goes up ~6 pins."
"My average was 155 eight weeks ago. It's 162 now. Spare shooting improved 8%."
The bowler in both scenarios has the same physical ability. The difference is that one of them knows exactly where they're losing pins — and has a plan to fix it.
Every session tracked. Every trend visible.